Dashboard on Baccalaureate Exam Results
Power BI
Dashboard
This project presents an interactive dashboard designed to help public authorities explore exam results data and identify regions and educational tracks in France that require targeted support.
1 Business Problem
The French Ministry of Education is planning to release new funding aimed at improving baccalaureate exam pass rates. However, before allocating these resources, the Ministry is seeking to better understand disparities in pass rates across regions, as well as potential variations by gender and education track.
To support this effort, the Ministry has commissioned our data analytics company to develop a user-friendly Power BI dashboard that visualizes the results of the 2023 and 2024 baccalaureate sessions. This tool is intended to help the non-technical funding team easily explore and understand patterns in success rate across France.
2 Data Preparation
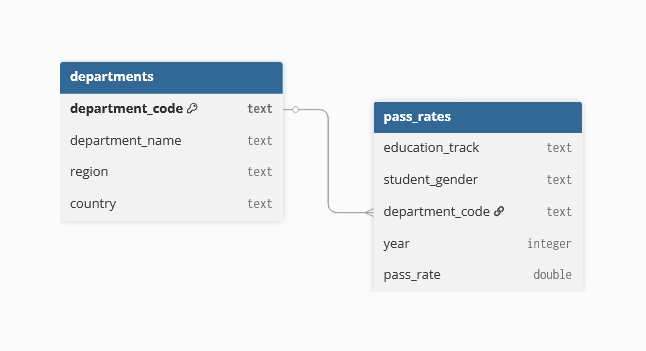
The dataset was sourced from the French Ministry of Education’s open data portal1. The quality of the data was excellent. There were no missing values, formatting issues or duplicates. However, to reduce redundancy in the original flat file, the data was restructured into two separate datasets:
Geographical dataset: includes information of French departments.
Success rate dataset: contains annual baccalaureate pass rates.
This separation improves the maintainability and scalability of the project. It makes it easier to update the dashboard with new data and to fix or improve it when needed.
Power Query was used to import and clean the data. This involved selecting appropriate data types and formats for each field, as well as creating new variables, such as a hierarchical structure2 linking departments to regions.
The data model3 is based on a simple one-to-many relationship: each record in the departments table corresponds to one or more records in the pass_rates table. This structure supports the multiple years of data (2023 and 2024) included in the dataset.
3 Dashboard Elements
The dashboard has been designed with clarity in mind to ensure that anyone can easily explore and understand the data. It contains five interactive visuals, each focused on highlighting key insights about baccalaureate exam pass rates in France.
Here’s a quick overview of each element:
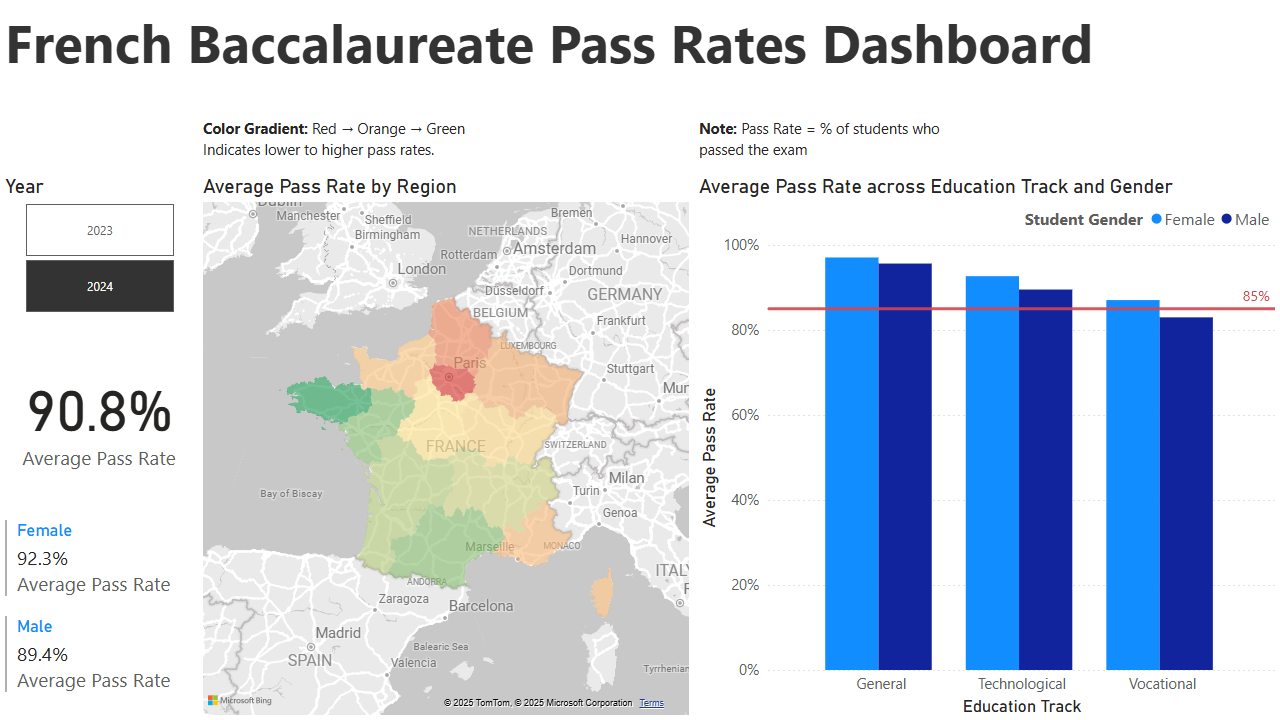
Session Year Filter (Slicer)
Allows users to toggle between the 2023 and 2024 exam sessions to analyze year-over-year changes. This allows decision-makers to track trends and identify regions or groups that may have improved or declined.Overall Pass Rate (Card Visual)
Displays the average national pass rate across all students and regions, serving as a national performance indicator.Pass Rates by Gender (Multi-row Card)
Breaks down average pass rates for male and female students, offering a quick way to compare gender-based performance and spot any disparities.Geographical Distribution (Filled Map)
Illustrates regional and departmental pass rates using a red-to-green color gradient. This helps identify areas that may require more support or intervention.Pass Rates by Track and Gender (Clustered Column Chart)
Breaks down the average pass rate by education track (general, technological, vocational) and gender. This helps highlight how different educational paths perform and whether gender plays a role within each track.
All visuals in the dashboard are interactive and connected. Selecting a region, for example, updates the other visuals to show relevant details by gender and education track. This interactivity helps answer questions like which regions improved over time or how different student groups performed.
4 Key findings
The goal of this report is to provide clear, actionable insights to support funding decisions aimed at reducing disparities in baccalaureate pass rates. By analyzing the dashboard visuals, three key data-driven findings emerge:
Regional disparities: Île-de-France underperforms
In 2024, the Île-de-France region recorded the lowest average pass rate at 87.1% (Map Visual), while the national average was 90.8% (Card Visual) – a trend also observed in 2023. A closer look reveals two departments in this region that may require additional support:- Val-d’Oise: 83.8% pass rate
- Seine-Saint-Denis: 85.2% pass rate
Gender gaps are more pronounced in specific departments
In both Val-d’Oise and Seine-Saint-Denis, female students outperform male students by an average of 7% (Multi-row Card). This is more than twice the national gender gap, approximately 3%, suggesting that gender-based performance differences are more severe in these departments.Underperformance concentrated in vocational and technological tracks
Vocational and technological tracks are the main contributors to the overall underperformance in Val-d’Oise and Seine-Saint-Denis (Clustered Column Chart). In particular, male students enrolled in these tracks have pass rates below 85%, highlighting a critical area for targeted intervention.
Watch the short demonstration video below to learn how to use the dashboard to discover these insights.
5 Recommendations
The findings above point to a specific group that would benefit most from targeted support:
- Students in Val-d’Oise and Seine-Saint-Denis enrolled in vocational and technological education tracks.
Focusing funding and intervention efforts on this group could have a significant impact. In particular, it would help reduce disparities in pass rates across regions, gender and education tracks. For example, the French Ministry of Education could:
Increase the number of teachers to reduce class sizes and improve student attention during lessons.
Provide tutoring sessions to help support students in vocational and technological tracks.
These steps would help create more equitable learning conditions and improve overall performance on the Baccalaureate exam.
Footnotes
The dataset used in this project was downloaded on 2025-09-22, and titled Réussite au baccalauréat par département.↩︎
A hierarchical structure is a way of organizing data where items are ranked or grouped in levels. For example, departments belonging to specific regions.↩︎
The term data model refers to the way data is organized in Power BI.↩︎